Collect Caddy logs securely using Prometheus: restrict admin API access
When you believe your homelab has reached his final form, you start thinking about monitoring everything. That includes caddy which for me is the main entry point to my services.
A small peek into my homelab network structure...
I have two caddy containers running on the same machine:
caddy: the main reverse proxy for external services. Incomming requests are protected by both Crowdsec and Cloudflare.caddy-internal: the reverse proxy for my internal services allowing for internal HTTPS.
When I need to access a webUI exposed by another container (Immich, Nextcloud, Komodo...) it is exposed through caddy or caddy-internal container. Everything is routed through docker internal networks. No container is directly exposed on my actual LAN or directly to the internet without going through one of my caddy proxies. Proxies are specifically hardened to have port 80 and 443 exposed to the outside world, they are built for this kind of use cases and we should not be afraid to use them !
This is what is looks like on a diagram :
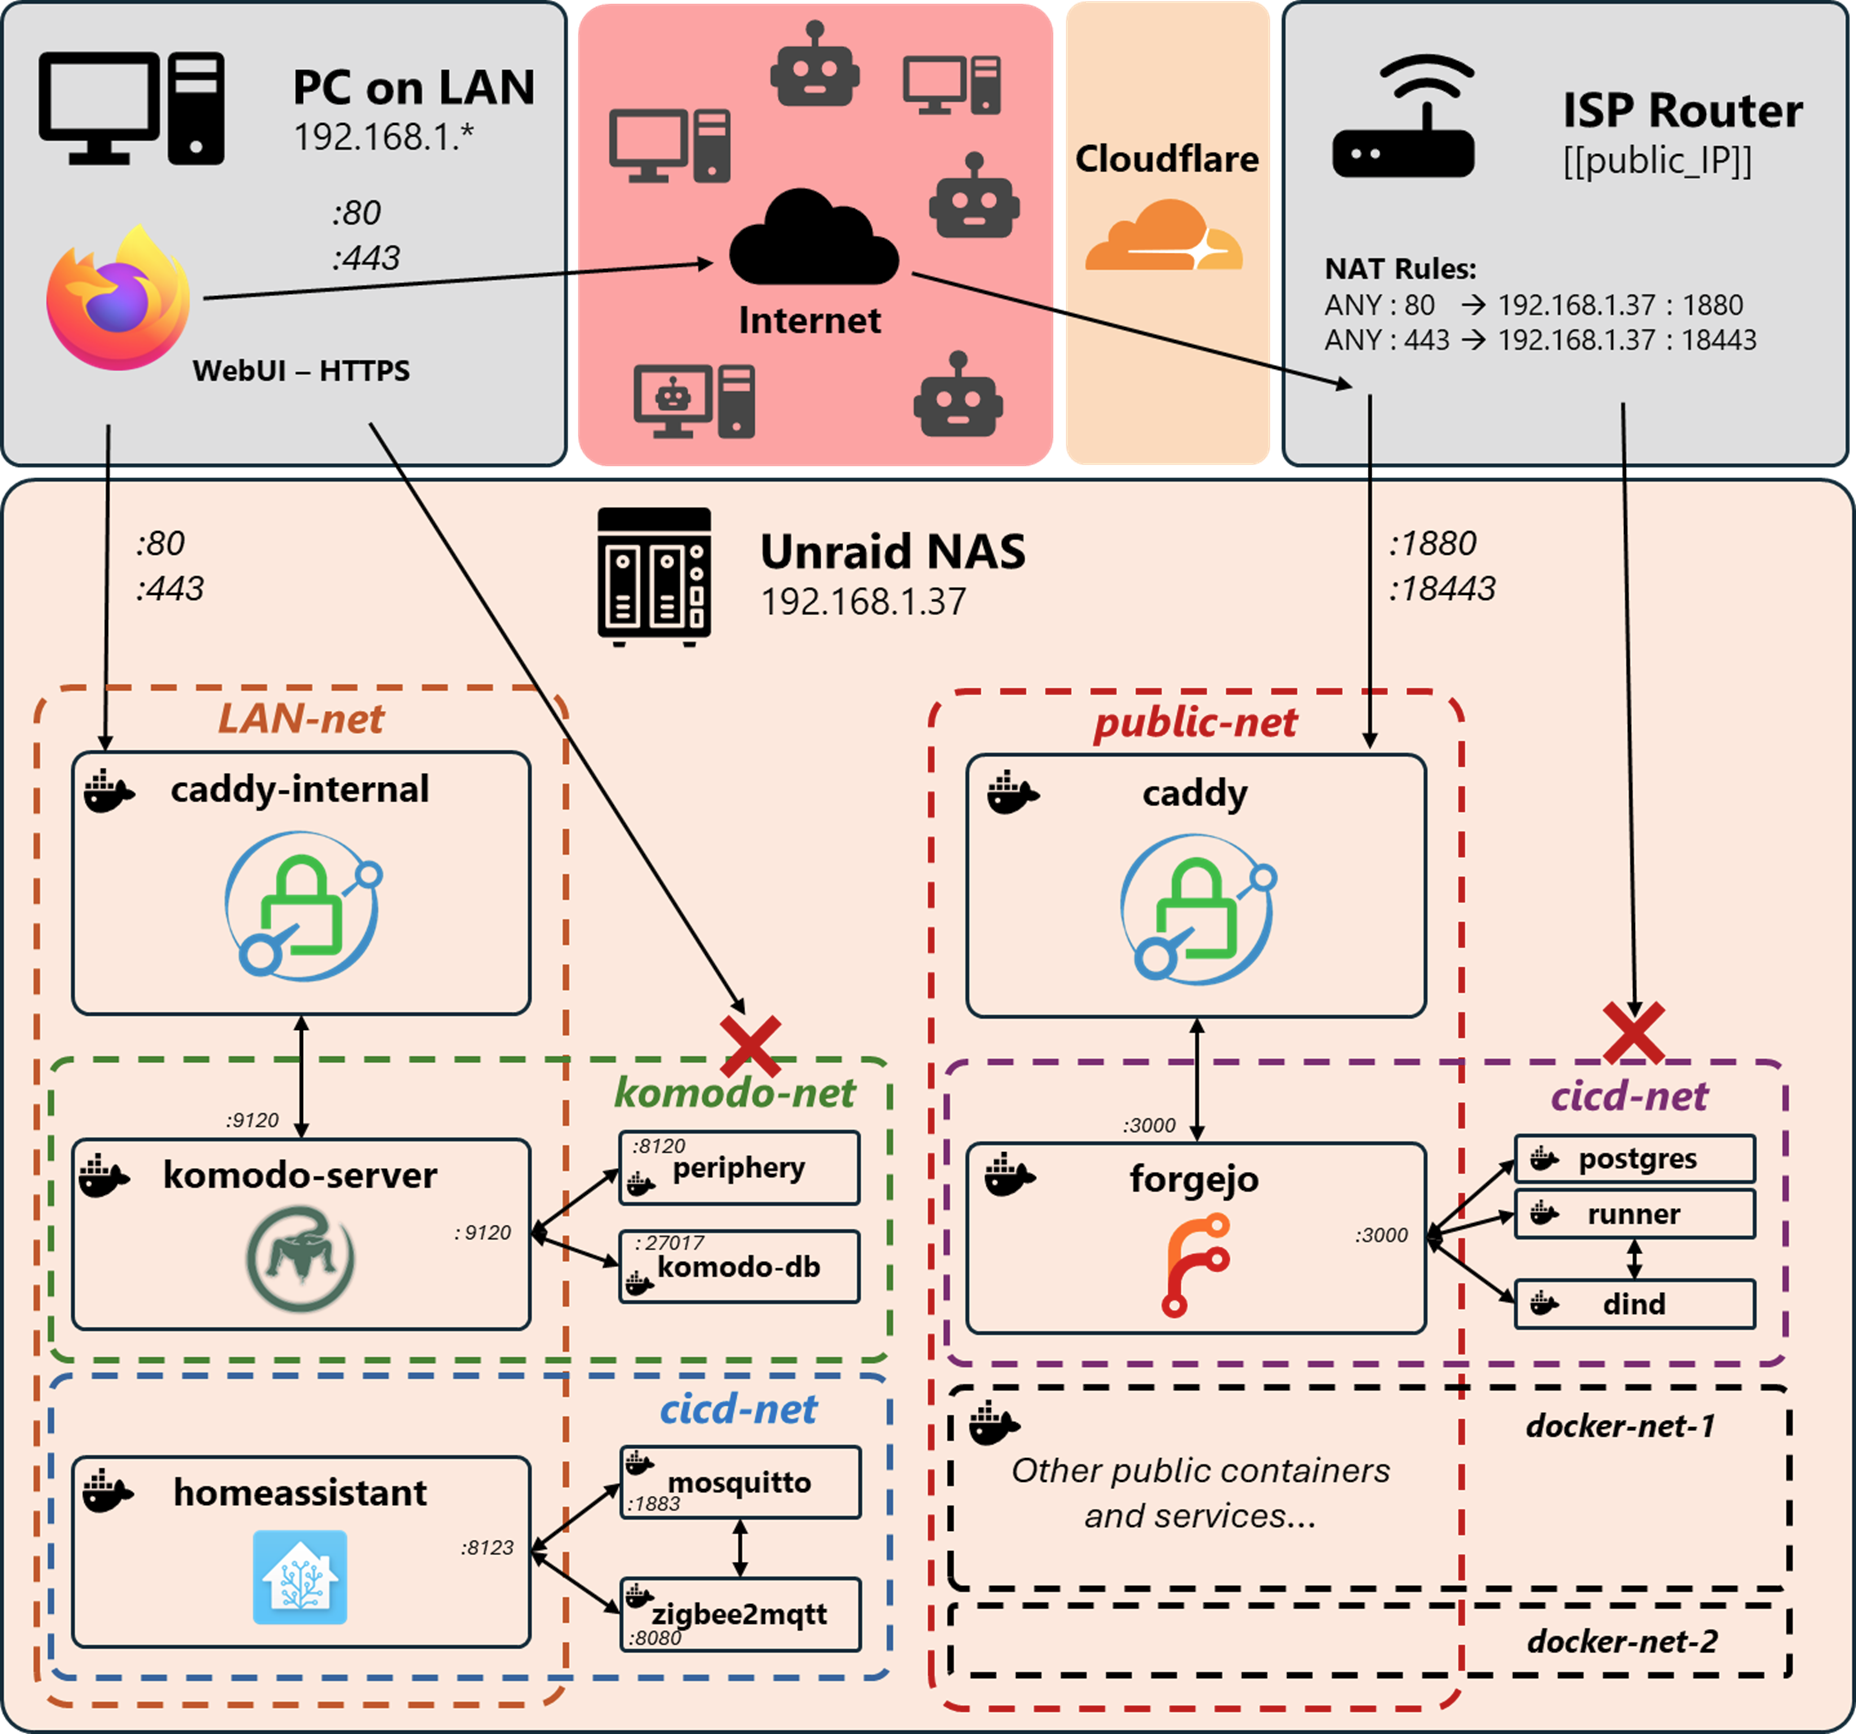
Each docker-compose stack has its own docker network. All services sit in that docker network by default. If one of the service needs to be exposed to the outside (e.g. webUI) then I connect the service to one of the caddy network allowing external access.
This is what the CICD stack looks like :
#######################
# 🦎 CICD COMPOSE 🦎 #
#######################

services:
  forgejo:
    image: codeberg.org/forgejo/forgejo:14.0.3
    ...
    networks:
      - cicd-net
      - public-net

  postgres-forgejo:
    image: postgres:17.9
    ...
    networks:
      - cicd-net

  dind: # Docker in Docker managed by the runner
    image: docker:29.3.0-dind
    ...
    networks:
      - cicd-net

  runner:
    image: code.forgejo.org/forgejo/runner:12.7.1
    ...
    networks:
      - cicd-net

networks:
  cicd-net:
    external: true
  public-net:
    external: true
Notice that there are no ports: -3000:3000 needed to expose forgejo to the internet because everything goes through caddy container in the public-net.
No one on my LAN can access the dind socket because it is only available in the docker network cicd-net.
There are no way to bypass HTTPS or Caddy when accessing Forgejo webUI.
What about caddy and your monitoring problem ?
Well it's more of a security issue.
To monitor a caddy container and get metrics with some kind of *Prometheus-magic* you need to give access to port :2019 of your caddy container. This is where the metrics API lives. However, port :2019 does not give access only to a /metrics endpoint it gives full admin access to your Caddy configuration ! If you expose that port on your LAN or to any other compromised container you are giving full access to your proxy configuration. Even worse: if caddy has access to Cloudflare API keys (used for DNS-01 challenge) then you could unknowingly give read / write access to your own domain DNS reccords.

There is no authentication available on this API which is understandable as it is not supposed to be exposed anywhere. Instead caddy recommends to setup a UNIX socket :
To use a unix socket for the admin API, allowing access control via file permissions: { admin unix//run/caddy-admin.sock }I'm stubborn. I don't really want to use a UNIX socket to connect Prometheus to Caddy. I want to setup a regular scrapping job:
global:
...
scrape_configs:
  - job_name: 'caddy'
    scrape_interval: 15s
    static_configs:
    - targets: ['caddy-internal:2019', 'caddy:2019']
Intended prometheus.yml
Doing so risk exposing the Caddy admin API to all containers in the same docker network as caddy. If a container is compromised, an attacker does not need to escape the containerization layer to lateralize: the attacker just has to reach for caddy on port :2019.
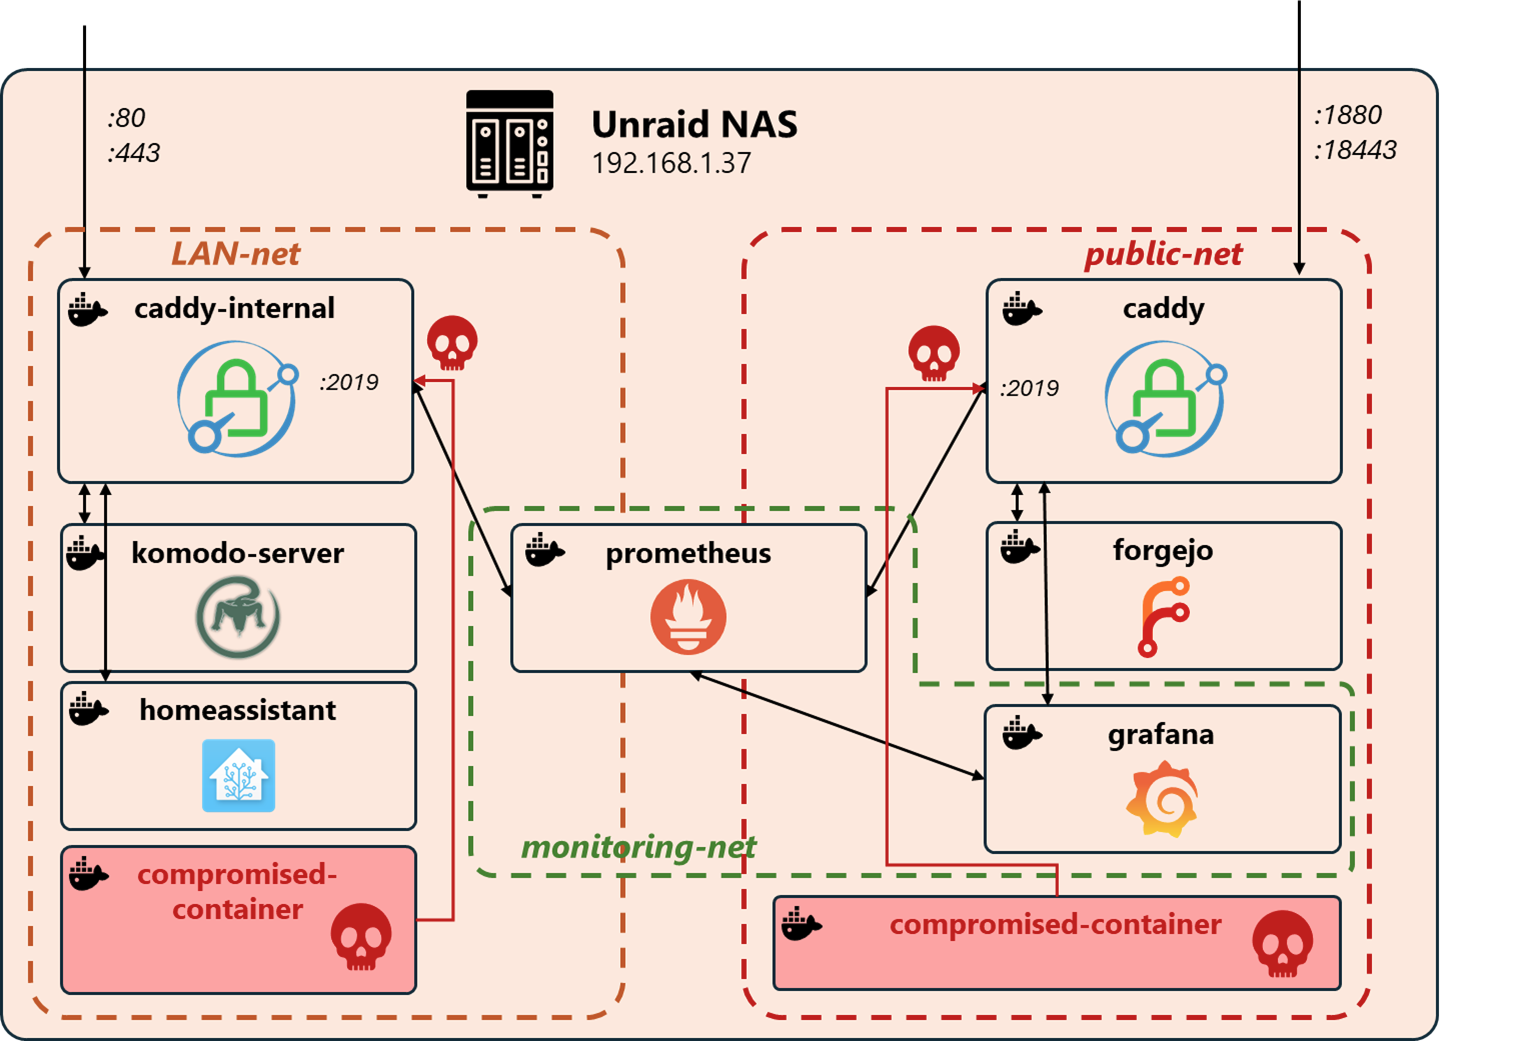
This is not good, we need to find a way to restrict the admin API on port :2019.
Restricting Caddy admin API
We can either restrict the privileges or restrict the network access (or both?).
Our first option is to restrict the network access, i.e restricting the port :2019 only to prometheus container. However prometheus would still have access to the /load endpoint of the API which allows setting or replacing the active configuration... This also requires some complex docker network configuration. There is no real "docker firewall" between docker networks and docker containers.
The better way to resolve this is to deactivate all external access to port :2019 (default is restricted to localhost which means you can reach the API only from whithin caddy container) and create a new service on port :2020. The port :2020 gives access to the /metrics endpoint and nothing else !
:2020 {
    # Proxy /metrics and make it appear like it comes from localhost.
    # Port 2019 only accept requests from localhost (default).
    handle /metrics {
        reverse_proxy localhost:2019 {
        	header_up Host {upstream_hostport}
        }
    }
    handle {
        abort
    }
}
Caddyfile
caddy:2020/metrics is reachable by other containers on the same docker network but these containers are not able to access the real admin endpoints like caddy:2020/load. In the worse case, if a container is compromised only Caddy metrics are accessible. The attacker would be able to start a reconnaissance phase but not move lateraly.
Don't forget to adjust the scapping job in prometheus container:
global:
...
scrape_configs:
  - job_name: 'caddy'
    scrape_interval: 15s
    static_configs:
    - targets: ['caddy-internal:2020', 'caddy:2020']
Adapted prometheus.yml
It is not within the scope of this post to show the rest of Prometheus-Grafana integration as there are already lots of documentation online. I can still show you what it can look like. Putting it all together with Grafana can give you something like this:
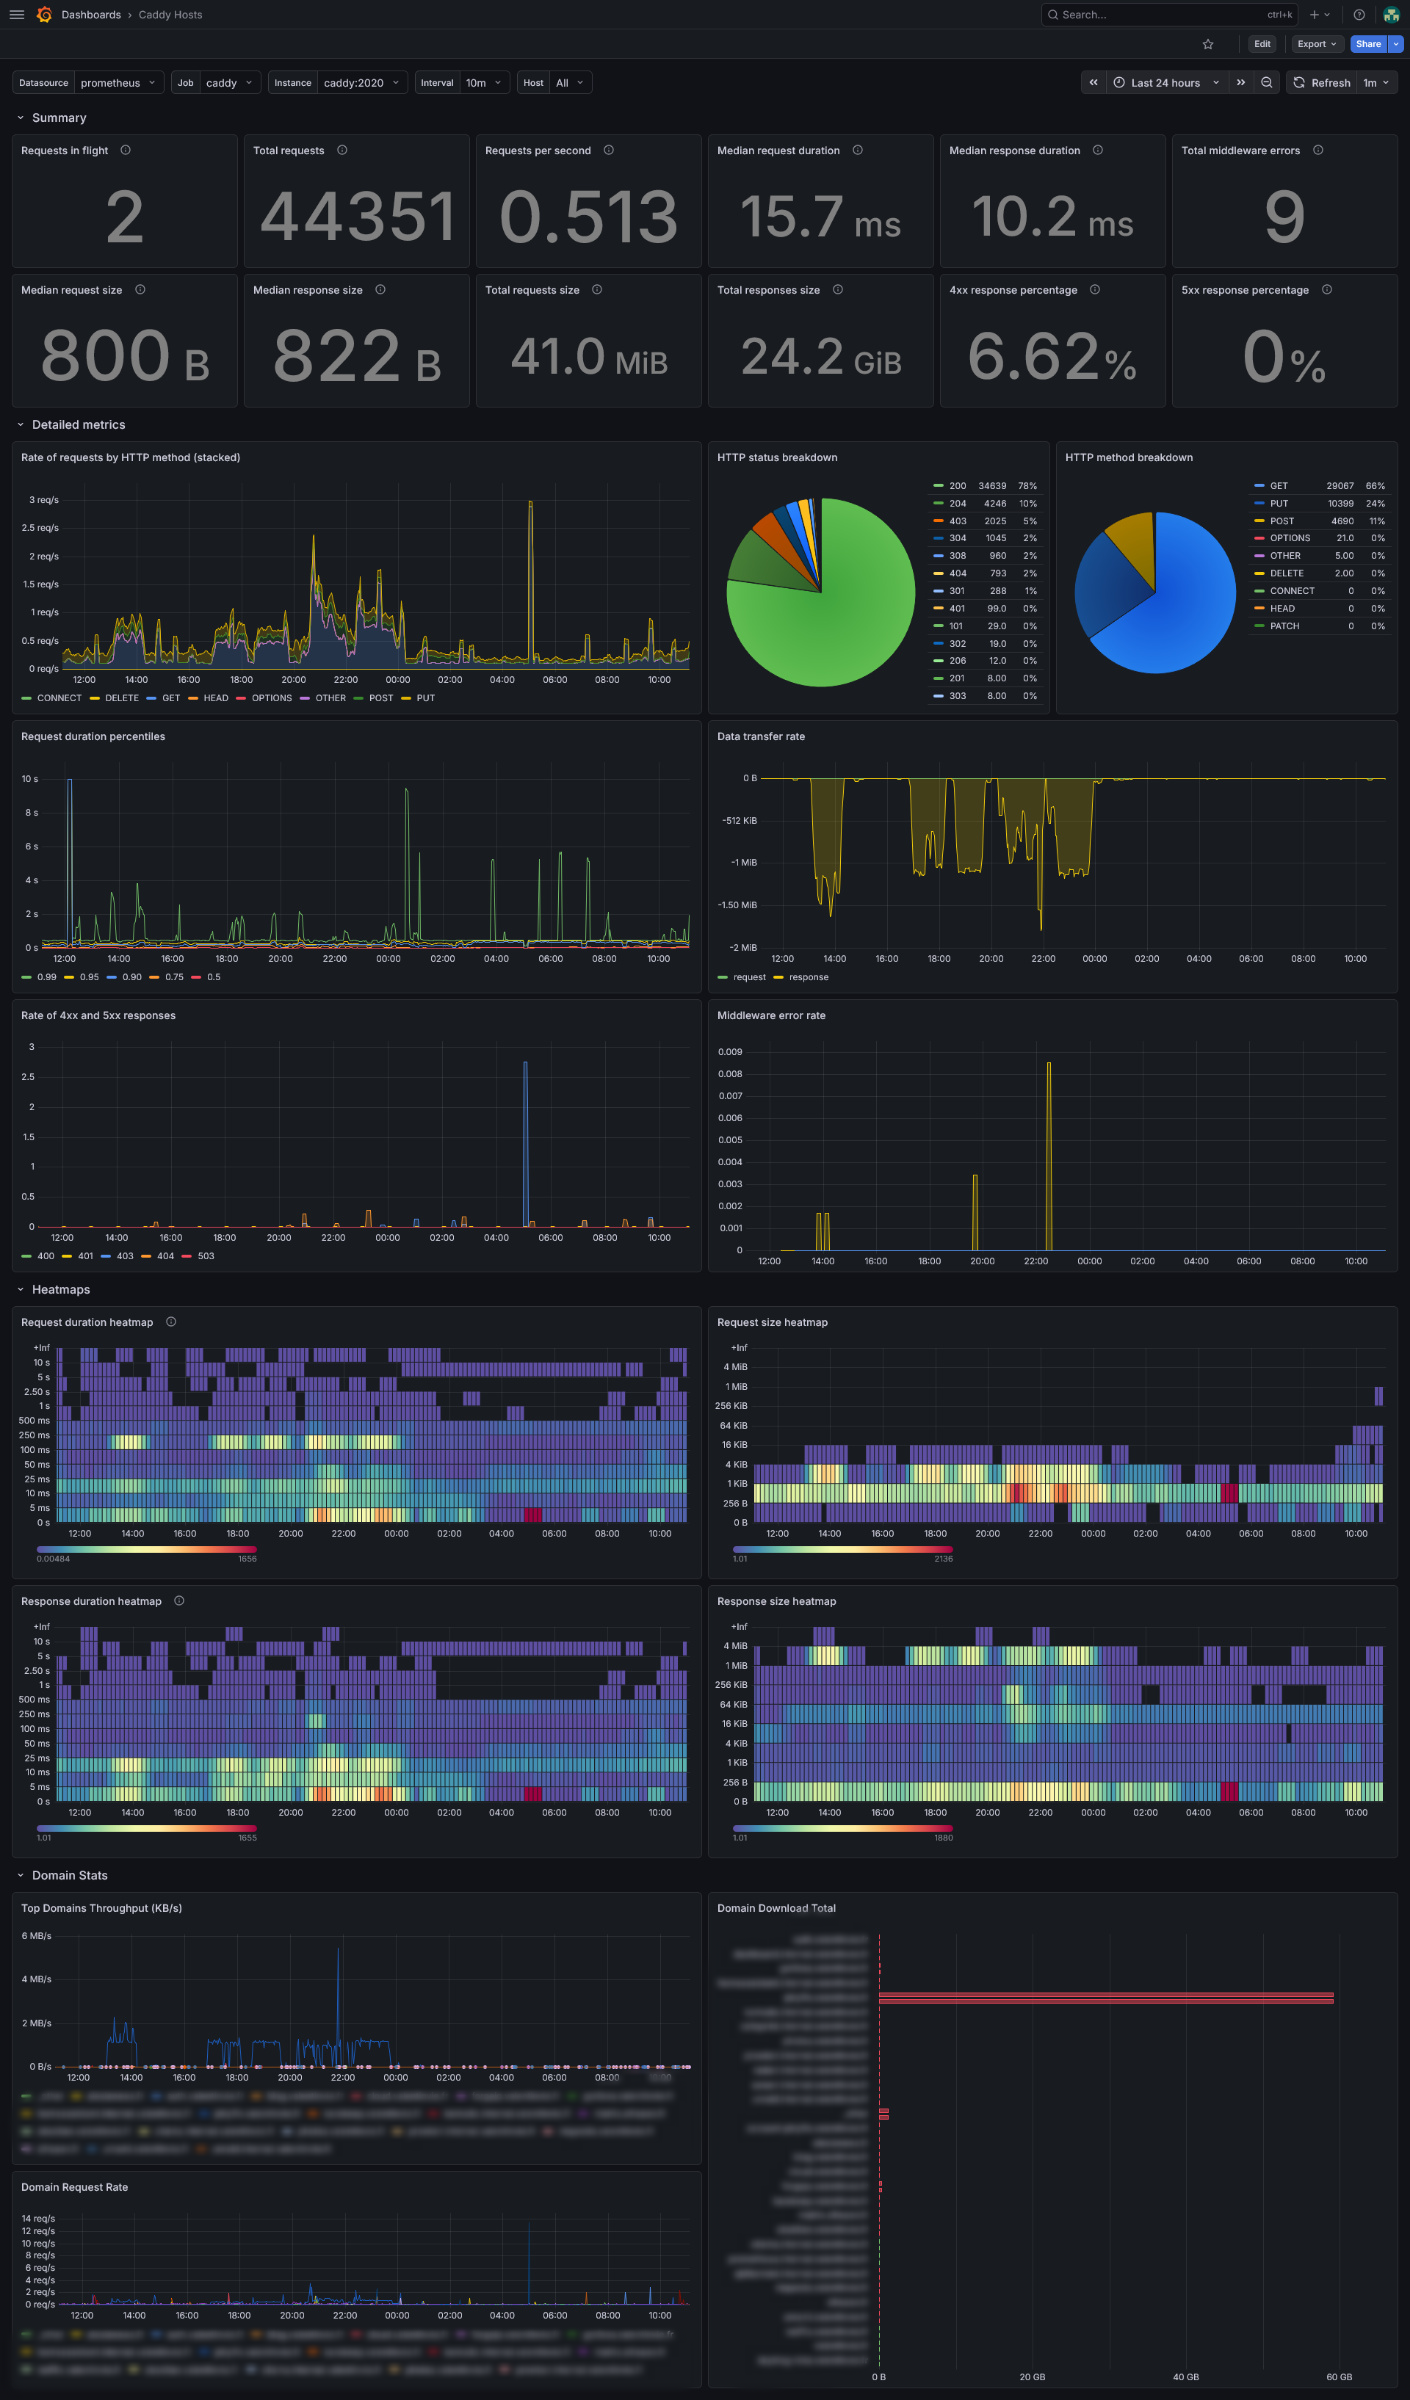
Notice the peak jellyfin activity between 5PM and midnight ?